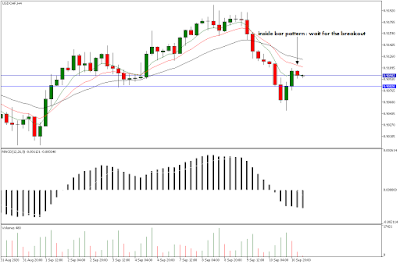
1. USD / ZAR - 9/9/2020 ; H4 Timeframe
My favourite moving averages are aligned upwards and price is above them , formation of the inside bar pattern between 16.9620 and 16.8409 shows me that the war between bulls and the bears has taken a break , i will wait for a break out of the pattern for me to go long. MACD histogram showing us precence of bullish power .
currently the time is 9:48 wait for noon so as to take the set up if price gives us the signal.
2. GBP/CAD - 9/9/2020 ; H4 Timeframe
Moving averages are aligned downward and price is below them , formation of the inside bar pattern between 1.72189 and 1.71590 shows me that the war between bulls and the bears has taken a break , i will wait for a break out of the pattern for me to go short. MACD histogram showing us precence of bear power but price is the king we wait for it .
currently the time is 9:54 wait for noon so as to take the set up if price gives us the signal
2. AUD/NZD - 9/9/2020 ; H4 Timeframe - Price at Resistance Zone
For this pair price is at a resistance zone around 1.08971 intrestingly we also have a red trendline that has been tested twice in the past, formation of an inside bar pattern tells us to pause and observe what happens next - if it breaks above the pattern we get a long position if it breaks below it then short we go.
I intend to take only a position that goes according to my plan which is very simple follow the trend and i use the inside bar to solve the puzzle .